Looking Beyond the Luxury Market –
Are Homebuilders Building More for You and Me?
BY SARA KRAMER, VICE PRESIDENT, AND MARK TRAINER, SENIOR ASSOCIATE
BUILDING FOR THE TOP
Is the entry-level home a thing of the past? It has largely appeared that way throughout much of the post-recession period, as homebuilders have disproportionately targeted the luxury market through larger and more expensive offerings. Stricter mortgage financing standards have impeded the ability of entry-level buyers to qualify, pushing builders toward upper market segments with the least credit risk. Moreover, low levels of lot availability, rising labor costs, and increased regulatory burdens have amplified the appeal of lower-volume, higher-margin new housing options.
As the recovery endures, however, market-depth limits for luxury new housing segments are beginning to emerge. A recent Redfin analysis found luxury home prices rose by 0.7% in 4Q 2016 year-over-year, compared with 6.1% price growth for non-luxury properties, which marked the eighth consecutive quarter the segment has underperformed relative to the rest of the market.[1] With this recent softening at the top of the market, are builders beginning to expand their appeal to broader market segments?

WHERE TO NEXT? A PRIMER ON MISSING MIDDLE DEMAND
As RCLCO has previously reported, there is a growing mismatch between buyer preferences and available new home supply. American homebuyers overall continue to prefer larger homes than those they currently occupy. However, the emerging demographic evolution of the two largest demographic cohorts—with millennials increasingly aging into prime family formation years and baby boomers becoming empty nesters—suggests trending consumer preferences toward more midscale and mid-priced, or “missing middle,” product. Both groups are more amenable to smaller floor plans, primarily due to price point or lifestyle considerations, respectively.
Post-recession, younger buyer segments have largely been on the sideline of the for-sale housing market recovery. First-time homebuyers’ share of the overall housing market remained low at 35% in 2016, which while up from 32% in 2015, was well below the historical average of 40% market share and especially significant given younger households’ relatively high current share of the U.S. household base.[2] This low share is not entirely attributable to changing consumer preferences toward rentership, as 70% of millennials still expect to become homeowners by 2020.[3] Moreover, 55% of non-owners cited “can’t afford to buy a home” as the main reason they are not currently homeowners, compared with 31% attributing their rentership to life stage or consumer preference factors.[4] Though millennials prefer larger homes than they currently occupy, 2,375 square feet versus an existing median of 1,705 square feet, affordability considerations suggest that smaller floor plans at more attainable price points are the only option for many of those seeking to enter the for-sale market.
Older generations are rapidly transitioning into later life stages as well, where both the absence of children at home and lower appetite for household maintenance reduce the appeal of larger homes. Baby boomer (1946-1964) and senior (pre-1946) buyers, who are typically in the best financial position to afford new housing, desire smaller floorplans with medians of 1,879 square feet and 1,791 square feet, respectively, to accommodate their changing lifestyles.[5] Among likely movers, 73% of baby boomers and 83% of seniors are seeking either the same size or smaller floor plans, creating a market opportunity for higher-quality, smaller-format new construction.[6]
NEW PRODUCT INCREASINGLY TARGETING THE MIDDLE OF THE MARKET
The past few decades have been characterized by increasingly larger homes—with the only exception occurring between 2008 and 2010 due to economic uncertainty and a first-time homebuyer tax credit incentivizing entry-level homes—while average household sizes have dropped to historical lows. With a softening luxury home segment, alongside the rising influence of entry-level millennials and downsizing baby boomers, homebuilders are beginning to shift their approach in order to expand market appeal. After largely plateauing throughout 2014 and 2015, with a Q3 2015 peak of 2,488 square feet, median new home sizes have begun to gradually decline over the past year to 2,400 square feet in Q4 2016. This moderate shrinkage trend is largely consistent across each geographical region for which data is available, suggesting this phenomenon has broad geographical traction.

SOURCE: U.S. Census Survey of Construction; Current Population Survey

SOURCE: U.S. Census Survey of Construction
With new home sizes declining moderately, the increase in average new home price slowed to 3.4% in 2016, the lowest annual increase since 2011. Throughout much of the recovery, high-priced product fueled the new home market, with annual sales volume increases generally above 20% year-over-year. However, the upper end of the market has slowed significantly over the past year, with an especially precipitous drop-off in sales volume growth in the $750,000+ price band. Conversely, accelerating sales growth within the more moderately priced $300,000 to $400,000 band has propelled the new home market forward by creating more attainable options for prospective homebuyers. Moreover, the ratio of new home prices to existing home prices also registered a modest decline over the past year, suggesting new home product is becoming slightly more attainable relative to existing homes, even though this ratio remains near historical highs.

SOURCE: U.S. Census Survey of Construction

SOURCE: U.S. Census Survey of Construction, Case-Shiller Home Price Index
WILL THE TREND CONTINUE?
As the luxury market shows signs of softening, homebuilders are beginning to adapt to changing demographic conditions by constructing more moderately priced and sized new home product. Though underlying constraints, such as strict mortgage financing standards and escalating costs, remain largely unchanged from the beginning of the recovery, strengthening demand drivers from the aging of millennials and baby boomers, along with rising household incomes for average Americans, have increased the relative appeal of “missing middle” product options for builders. These more moderately priced for-sale product options will become increasingly important to the extent rising interest rates further erode affordability. Though yielding lower per-home margins, savvy builders and developers are recognizing the positive bottom-line benefits of higher-velocity, higher-density development strategies.
REFERENCES
[1] Phil Banker, “Luxury Homes Outpaced by Rest of Market,” MReport, January 25, 2017, accessed February 08, 2017, http://www.themreport.com/news/01-25-2017/luxury-homes-outpaced-rest-market.
[2] National Association of Realtors, 2016 Profile of Home Buyers and Sellers, Chicago: NAR, 2016, https://www.nar.realtor/sites/default/files/reports/2016/2016-profile-of-home-buyers-and-sellers-10-31-2016.pdf.
[3] M. Leanne Lachman and Deborah L. Brett, Gen Y and Housing, Washington, DC: ULI, 2015, http://uli.org/wp-content/uploads/ULI-Documents/Gen-Y-and-Housing.pdf.
[4] National Association of Realtors, Aspiring Home Buyers Profile, Chicago: NAR, 2017, https://www.nar.realtor/sites/default/files/reports/2017/2017-aspiring-home-buyers-profile-02-01-2017.pdf. 2017 Aspiring Home Buyers Profile survey includes all age groups, but 59% of non-owners are aged 34 and under.
[5] Rose Quint, Housing Preferences Across Generations, Washington, DC: NAHB, 2016, http://www.nahbclassic.org/generic.aspx?sectionID=734&genericContentID=249797&channelID=311&_ga=1.135937459.347344660.1485838344.
[6] Urban Land Institute, America in 2015: A ULI Survey of Views on Housing, Transportation, and Community, Washington, DC: ULI, 2015, http://uli.org/wp-content/uploads/ULI-Documents/America-in-2015.pdf.
Article and research prepared by Sara Kramer, Vice President, and Mark Trainer, Senior Associate.
RCLCO provides real estate economics and market analysis, strategic planning, management consulting, litigation support, fiscal and economic impact analysis, investment analysis, portfolio structuring, and monitoring services to real estate investors, developers, home builders, financial institutions, and public agencies. Our real estate consultants help clients make the best decisions about real estate investment, repositioning, planning, and development.
Disclaimer: Reasonable efforts have been made to ensure that the data contained in this Advisory reflect accurate and timely information, and the data is believed to be reliable and comprehensive. The Advisory is based on estimates, assumptions, and other information developed by RCLCO from its independent research effort and general knowledge of the industry. This Advisory contains opinions that represent our view of reasonable expectations at this particular time, but our opinions are not offered as predictions or assurances that particular events will occur.

UNDERSTANDING AIR BARRIERS
Understanding how air barrier materials and systems are evaluated and knowing their performance characteristics will help you find the right solution for your project needs.

Controlling the movement of air between indoor and outdoor environments is a key concern when building comfortable, energy efficient homes. According to the U.S. Department of Energy, up to 40 percent of the energy used to heat and cool a building is due to uncontrolled air leakage. Therefore, it is important for builders to have a thorough understanding of air barrier materials and installation strategies.
Quite simply, an air barrier is a material or system of materials designed to control air flow between a conditioned space and an unconditioned space. A building material can be defined as an air barrier if its air permeance is equal to or less than 0.02 L/(s-m2) @ 75 Pa when tested in accordance with ASTM E2178. Alternately, an air barrier system can be tested for air leakage, which must be equal to or less than 0.02 L/(s-m2) @ 75 Pa when tested in accordance with ASTM E2178. Air barriers can also be defined through whole building testing.
In 2012, the International Energy Conservation Code (IECC) began requiring continuous air barriers, and a growing list of states now include them in their building codes. Though there are many ways to prevent air movement through a building assembly, not all air barriers are equal. It is important to understand the forces working against an air barrier and the properties that will help it stand up to them. After all, an air barrier’s performance is defined by its weakest link, and it only takes one tear or unsealed connection to compromise the integrity of the entire system.
As the primary boundary between indoor and outdoor air, the air barrier assembly will be subjected to constant air movement, water, ultraviolet light, and surfactant chemicals present in certain cladding materials and cleaning agents. Any one of these elements could potentially cause materials to break down over time, jeopardizing their effectiveness. Likewise, if a material isn’t durable enough to stand up to installation conditions, it won’t be able to do its job.

Though builders have traditionally used wood pulp based building paper when constructing weather resistant barriers, newer plastic housewraps offer greater benefits in durability and ease of installation. TYPAR’s Weather Protection System, for example, is surfactant resistant, offers six months ultraviolet light exposure resistance, and has a tear strength almost five times greater than competitive wraps.
Equally important as selecting the right material, proper installation is critical in order for an air barrier system to work as intended. Sealing all laps and penetrations with the proper tape can improve the building wrap’s performance by 20 percent. Even if the primary air barrier material meets ASTM requirements, continuity of the air barrier system can be compromised by incompatible tapes and flashing or improper installation.
The simplest way to be sure the entire system will work together effectively and meet all code requirements is to specify wrap, tapes and flashing from a single manufacturer. Doing so provides added assurance that each component will work together seamlessly, and often the system will be covered by the manufacturer’s warranty.
Understanding how air barrier materials and systems are evaluated and knowing their performance characteristics will help you find the right solution for your project needs. Approaching air barriers from a holistic view and evaluating the entire air barrier system—rather than just an individual material—will result in a tighter, more durable enclosure that can stand the test of time.
What Lumber Tariff Means for Builders
Analysis: New Canadian Softwood Tariffs May Have Limited Impact
Traders have been pricing in the new duties for months. And structural issues are buttress price hikes, too.

The U.S. government’s imposition of 20% countervailing duties will anger builders and delight dealers by helping prop up current prices, but it’s unlikely to lead to any new surge in the cost of softwood because traders have factored the duties into their prices for months.
In a sense, the news from Washington represents a reversion back close to how things were in 2006 through 2012, when the Softwood Lumber Agreement (SLA) was in place and a 15% export tax on Western Canadian shipments to the U.S. was common. (See table below.)
According to a fact sheet issued April 24 by the International Trade Administration, the U.S. government will impose these countervailing duties on these Canadian businesses:
- West Fraser Mills: 24.12%
- Resolute FP Canada: 12.82%
- Tolko Marketing and Sales and Tolko Industries: 19.50%
- Canfor: 20.26%
- J.D. Irving: 3.02%
- All other companies: 19.88%
Antidumping duties are expected later this year. Expectations are widespread that, by the time all the duties are in place, Canadian lumber will have 30% tariffs.
The National Association of Home Builders (NAHB) denounced its government’s action today, saying it was “deeply disappointed in this short-sighted action by the U.S. Department of Commerce that will ultimately do nothing to resolve issues causing the U.S.-Canadian lumber trade dispute but will negatively harm American consumers and housing affordability,” Roughly one-third of the lumber used in home building comes from Canada.
Soon after, NAHB’s chief economist declared that, if a 19.88% duty remained in effect all year, America would lose $498.3 million in U.S. workers’ wages and salaries,
$350.2 million in taxes and other revenue for governments in the U.S., and 8,241 full-time U.S. jobs.

The National Lumber and Building Material Dealers Association (NLBMDA) responded to the government’s move by continuing to call for the U.S. and Canada to reach a new long-term softwood lumber agreement. It favors a new SLA that, ideally, makes everyone happy by meeting domestic demand for softwood lumber, limiting harm to American lumber producers while unnecessarily restricting the availability of products, and avoiding detrimental increases in housing prices.
But while the countervailing duties are new, the impact of the decision has been in effect for months. According to Random Lengths, prices for framing lumber stuck between $340 and $370 per 1,000 board feet for most of the past year; it was at $346 in late April 2016. Meanwhile, the one-year cooling-off period after the end of the old SLA expired last October, Donald Trump was elected, and American lumber producers put in a new request for duties.
Those factors, plus the usual late winter runup in prices, pushed the Random Length framing lumber index to $437 as of April 21–a 26.3% gain. That increase has shaken home builders. “It takes about 15,000 board feet to build a typical single-family home and the lumber price increase in the first quarter of this year has added almost $3,600 to the price of a new home.”
By contrast, dealers report the higher prices are boosting their revenues, and they believe the higher prices will stick. As we wrote in February, there are several underlying reasons why this year’s price spike won’t produce nearly as dramatic a decline this spring as we’ve seen in previous years.
First, the mountain pine beetle that ravaged British Columbia for much of this century has killed killed huge swaths of trees in the province. As a result, the amount of wood that timber companies will be allowed to cut in future years will be reduced. Meanwhile, sustainable harvest levels are near their peak in eastern Canada and the U.S. West coast. “There is plenty of fiber in the U.S. South, but the skilled labor force is not where the trees are, so labor will be a limiting factor,” Paul Jannke of Forest Economic Advisors said in February. “We won’t be able to meet new demand with the existing capacity base.”

Meanwhile, demand is rising. Metrostudy, a sister company to ProSales, predicts the number of housing starts nationally will rise 14.3% this year to total 1.36 million homes.
And at the timber mills, there’s not enough spare production capacity at the mills in operation today. According to Jannke, it takes two years from the time when a company decides to invest in a new mill until the time that mill is operational. “That means it would be 2019 before we would get any significant new capacity coming on line,” he says. A few new mills have been announced, but their combined capacity won’t be enough to meet demand if we were to see 1.5 million to 1.7 million starts—and Metrostudy is predicting 1.52 million starts just next year.
ABOUT THE AUTHOR

Craig Webb is editor-in-chief of REMODELING and PROSALES. He has worked as a professional journalist since 1972 in newsrooms from Indiana to Italy for leading news organizations such as The Wall Street Journal, United Press International, McGraw-Hill, and—since 2006—Hanley Wood. Follow him on Twitter at @craiglwebb.
RING’S FLOODLIGHT CAM MARRIES SECURITY AND FUNCTIONALITY
RING’S FLOODLIGHT CAM MARRIES SECURITY AND FUNCTIONALITY

In this review by CNET writer Megan Wollerton, Wollerton looks at the pros and cons of Ring’s new Floodlight Cam, which combines the security of a camera with an outdoor lighting fixture.
The WiFi connected device comes with two LED lights and an integrated 1080p HD security camera. Users can set up motion alerts in the Ring app and designate activity zones, create schedules and control the built-in 110-decibel siren. Users can also access saved video history for $3 per month.
How does it compare to other products on the market? Wollerton writes:
Ring’s Floodlight Cam costs more than Kuna and Toucan, but less than Netatmo’s Welcome. At the same time, the Floodlight Cam has 1080p HD video resolution compared to Kuna and Toucan’s 720p HD. The Floodlight Cam’s $3 per month cloud storage fee is also less than Kuna and Toucan’s. The Welcome camera, on the other hand, has internal local storage so you don’t have to worry about a monthly expense at all. The Ring Floodlight Cam tacks on some additional features like activity zones and night vision (which Kuna and Toucan don’t offer). Ring also promises to add Floodlight Cam support for IFTTT, Samsung SmartThings, Wink and even Apple HomeKit soon. (A Ring representative told me Floodlight Cam’s are already outfitted with the Apple MFi chips needed for HomeKit, it’s just a matter of activating them.)
7 Bathroom Design Trends Home Buyers Want to Flush Away

Homeowners love their bathrooms. We totally get it—you spend a decent amount of time in there, and you want it to be the ultimate Zen oasis. And since potential buyers want that, too, you’re likely willing to splurge to make your lavatory lush and plush.
But one person’s lush can be another’s flush—as in flush away that weird or ugly bathroom decor before it drives you insane, or would-be buyers straight to another home.
No matter how lavish you think your loo is, beware of the design trends that will simply make buyers turn up their noses. And your bathroom doesn’t have to be a lime-green, laminate horror show to turn off buyers; there are some more subtle design trends that can also cause buyers to take a pass.
The bathroom “can actually be a deal breaker for some people,” observes Bee Heinemann, an interior design expert at Vant Wall Panels.
So before you take the plunge, assess these seven trends that design experts and home buyers would like to flush from the bathroom right now.
1. The all-white box

Stark white kitchens and baths have been a huge trend over the years, but their time in the spotlight is mercifully coming to an end, reports Tonya Bruin, CEO of To Do–Done Handyman Services.
The problem? Homeowners are finding it’s impossible to keep this room clean.
“White tile and flooring can stain very easily, and any little mark glares at you from across the room, tainting the crisp, clean concept of an all-white look,” she explains.
“I have so many homeowners coming to me now to ask for these white baths to be torn out and replaced with a more varied color design,” she adds.
If you’re guilty of going all-white but don’t want to tear out the whole room, there are ways to easily temper the look: Paint the walls, and add pops of color with bright towels, a bath mat, floral window valance, or sink skirt.
2. Minimalism
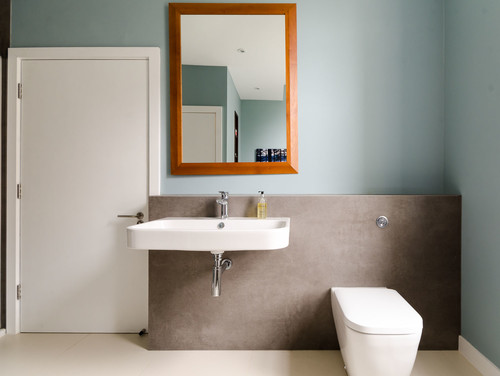
Photo by Moon Design + Build
A sparse bathroom can be relaxing: No clutter! Clean lines! But if the look is too bare, you’ll end up with a space that simply doesn’t work for everyday life. Just ask design expert Jessica Filoso, of real estate company CLV Group, who’s seen her share of near-empty bathrooms.
“The main issue with this trend is that you don’t have enough storage,” she points out. “With an overly minimalist design, you end up with all your stuff on the floor, which means your ‘simple look’ is one big mess.”
If your bath is on the empty side, keep buyers’ fears at bay by adding some more storage and personality. Étagères are a perfect spot for towels, toiletries, and tissue paper—and they’re chic and lightweight, too, so you can keep your minimalist theme.
Need more pizzazz? Hang a colorful piece of art, add a textured hamper, or arrange a trio of potted palms or ferns in the corner.
3. Overly funky color schemes
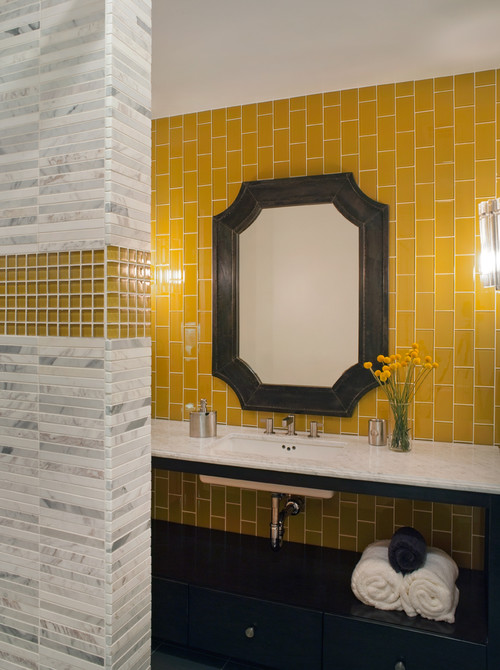
Photo by Lizette Marie Interior Design
Mustard. Salmon. Avocado. In small doses, they’re nice hues (and delicious foods!). But they aren’t very welcome in today’s powder room.
“Colors like these tend to be tacky-looking and make your bathroom feel like it’s stuck in the 1980s,” says Scott Allis with Miracle Method, a bath and kitchen refinishing company.
A retro look is a fine goal, but when it comes to selling the bathroom, it’s best to stick to a quiet palette—and balance the colors appropriately.
The most appealing, modern look is a mix of three colors in a 70/20/10 distribution.
“Use the neutral one most of the time (70% of the walls, floor, tile), a rich contrasting color for 20% of the look, and then an accent shade for the last 10%,” Heinemann explains.
4. That huge bathtub
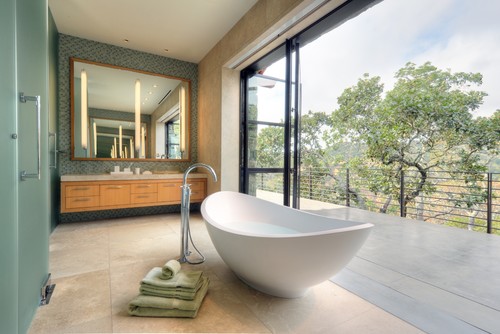
Photo by De Meza + Architecture
So you’re willing to shell out the dough to update your bathroom before you put your home on the market. Bravo! But when it comes to replacing your bathtub, we have a word of caution: Be realistic.
You might have scoured dozens of design magazines and come to the conclusion that your bathroom won’t be luxurious unless you can soak in a big, beautiful piece of porcelain. But who really has the time?
“This elaborate, oversize fixture is far from practical and actually has low resale value,” Heinemann says.
Indeed, the appeal of bathtubs has declined in recent years. As long as there’s one bathtub in the house (for buyers with kids), there’s no need for more—or a big, ostentatious soaker.
“Homeowners use these tubs once a month, tops,” Heinemann adds.
Instead, put your money into a quality, high-efficiency, water-saving shower.
“And if you really want a whirlpool, put in an outdoor version or an extension of an existing pool,” suggests Bea Pila, design pro and author of “Sacred Spaces for Inspired Living.”
5. Dual sinks
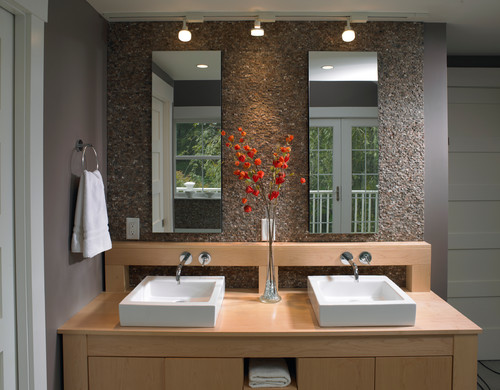
Photo by Michael Kim Associates
His-and-her sinks seemed like a good idea for a while: She has a dedicated spot for hair and makeup, and he has a personal basin for his shaving and grooming. But after years of carving out space in master baths for two matching sinks, designers and home buyers are backing away from the trend.
“Today most people wish they had more counter space, rather than that second sink,” Heinemann says.
But don’t rip out your two-sink look unless you’re already planning a bathroom rehab.
“Instead, add shelving near the sinks so there’s more storage,” Heinemann advises.
6. Medicine cabinets
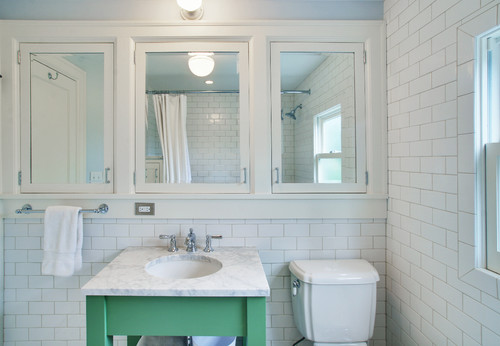
Photo by J.A.S. Design-Build
This one might make you pause—home buyers are all about more storage, right? But these mirrored boxes aren’t the way to go about it, says Andrea Stanford, vice president of marketing and partnerships at the online estate sale marketplace Everything But The House.
Yes, open shelving—which has been popular in kitchens for years—is making its way to the bathroom.
“People have beautiful products nowadays, and they want them to be seen and accessible,” Stanford says.
“A more modern storage trend now features plush stacks of towels, beautiful soaps displayed on a tray, and stand-alone vanities for perfume and makeup,” she adds.
As for the stuff you don’t want people to see, add a couple of woven baskets with matching lids.
7. Subway tile and nickel finishes
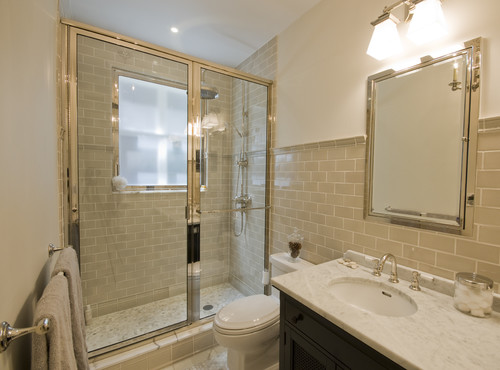
Photo by Linda Yowell Architects
There are some designers who will still install subway tile by default, but this ubiquitous design trend is starting to fade.
“Large-format tile is a good way to go, as are mini mosaics and geometric tiles,” says Nicole Rojas, a decorating guru with Tellus Design in Southern California.
Similarly, when it comes to hardware and accents, cool finishes (nickel and chrome, for example) are taking a back seat to brushed gold and even black, Pila reports.
“The silhouette is still clean and streamlined,” Pila says. “But these newer tones add an element of modernity and sophistication.”
Luckily for you, hardware is quite easy and inexpensive to swap out, so you can give your bathroom a modern makeover in an afternoon’s time.